
Docs · Hangar
SLOs
How Hangar declares a service-level objective, measures it, shows it, and tells you when it
changes. Last verified live on 2026-10-01 against the flight-api dev environment.
An SLO in Hangar is one entry in an application’s environment values file. Crossplane turns it into a Sloth resource, Sloth generates the burn-rate rules in Prometheus, and two things read those rules: Tower, which shows them, and a Backstage backend poller, which sends a notification when one of three signals changes.
Four diagrams below show the path from a values file to a notification. The interactive pages behind them follow your light or dark setting and live in the diagram gallery on hangarplatform.dev.
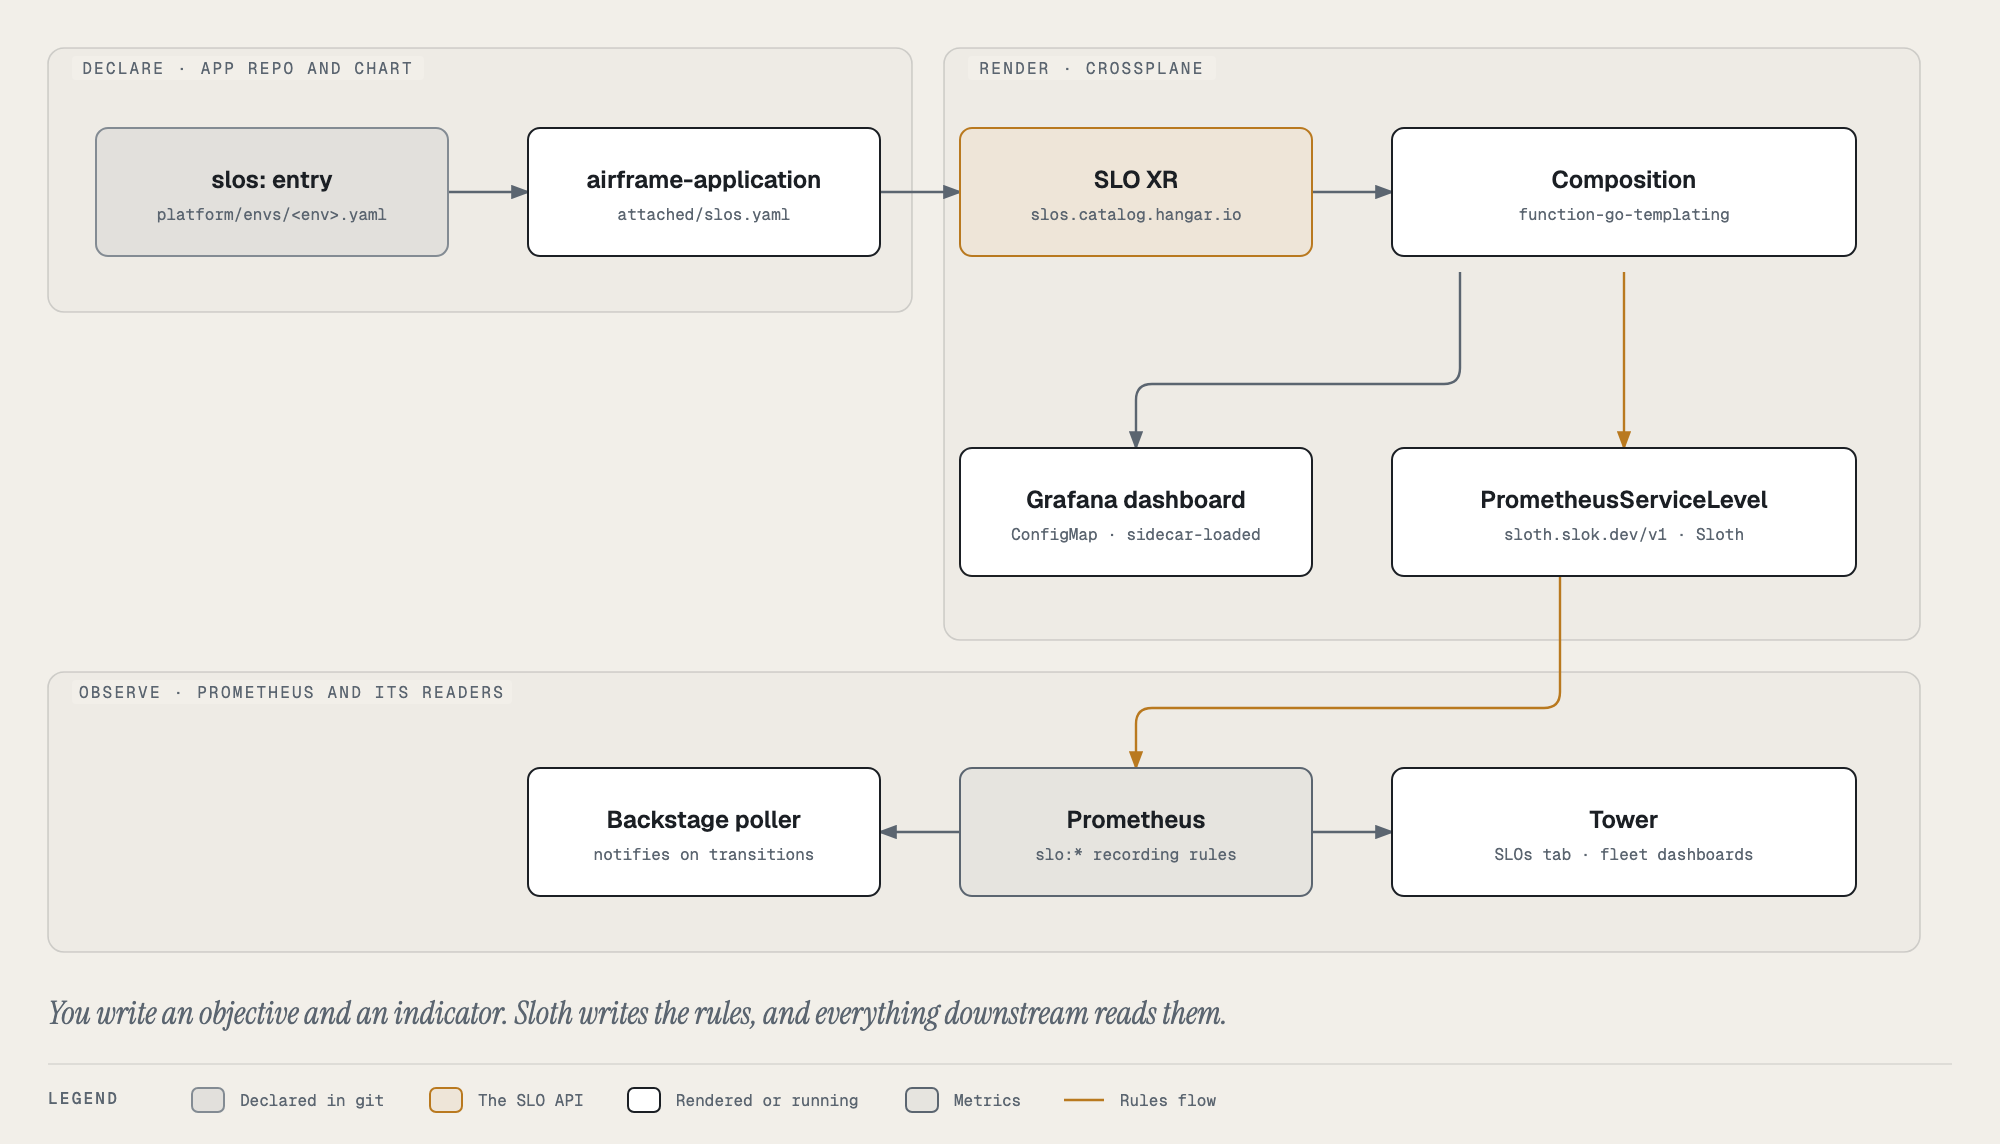
Declaring an SLO
SLOs live under slos: in an environment’s values file, for example
platform/envs/dev.yaml in the application repo. The
airframe-application chart renders each entry as one SLO resource in the
catalog.hangar.io group (templates/attached/slos.yaml). The chart passes every field through
and does not validate them. The XRD does (xrds/slo.yaml in Airframe).
slos:
  - name: flight-api-readiness
    service: flight-api
    objective: 95
    indicator:
      type: availability
      metric: prober_probe_total
      totalFilter: 'namespace="app-flight-api-dev",probe_type="Readiness"'
errorFilter: 'result="failed"'| Field | Meaning |
|---|---|
name |
The XR name. Also half of the series key (see below). |
service |
The value every generated query matches on its service label, and Sloth’s grouping field. Letters, digits, _, ., - only. |
objective |
Target percentage above 0 and up to 100, such as 99.9. |
indicator.type |
availability or latency. |
indicator.metric |
For availability, a counter such as http_requests_total. For latency, the histogram’s base name, without _bucket, _count or _sum. |
indicator.totalFilter |
PromQL label matchers selecting every eligible event. |
indicator.errorFilter |
Matchers selecting bad events. Required for availability. |
indicator.latencyThreshold |
Seconds, as a string such as "0.3". Required for latency. |
There is no window and no list of burn-rate alerts. Sloth owns both: the compliance window is a controller-wide default (30 days here), and Sloth computes the full multi-window alert set from the objective alone.
Two things bite people:
- A latency threshold must match a real
lebucket exactly, as Prometheus renders it. A mismatch produces a query that matches nothing. It never errors and never alerts. The XRD cannot check this, because bucket boundaries belong to the instrumented service. - A healthy availability SLO has no error series at all. The composition wraps the error
query in
or vector(0)so that “no errors” reads as zero rather than as an empty result that silently blanks every downstream rule.
kubectl get slo resolves to Sloth’s own category and finds nothing. Use kubectl get slos.catalog.hangar.io.
What Sloth generates
The composition creates a PrometheusServiceLevel and a Grafana dashboard ConfigMap (labelled
grafana_dashboard: "1" for the sidecar). Sloth then writes these recording rules, which are
the series everything else reads:
| Series | Meaning |
|---|---|
slo:period_burn_rate:ratio |
Error ratio over the whole window divided by the allowed error rate. Above 1 means the window’s budget is spent. |
slo:current_burn_rate:ratio |
The same burn rate over the shortest window (sloth_window="5m"). |
slo:sli_error:ratio_rate{5m,30m,1h,2h,6h,1d,3d,30d} |
Error ratio per window. Dividing by slo:error_budget:ratio gives that window’s burn rate. |
slo:error_budget:ratio |
The allowed error rate, 1 - objective. |
slo:period_error_budget_remaining:ratio |
Remaining budget for the window. |
slo:objective:ratio, slo:time_period:days |
Metadata. |
Every series carries sloth_service and sloth_slo. The sloth_slo value is
<name>_<namespace>, so the same SLO promoted to several environments stays distinguishable.
The separator is _ on purpose. It is legal in Sloth’s name validation and can never appear in a
Kubernetes namespace. A / was rejected by Sloth outright, and a separate namespace label broke
Sloth’s own ratio rules with many-to-many matching.
In Tower
- SLOs tab on an app. Shows a verdict, meeting objective when the period burn rate is at most 1 and breaching objective above it, with the current SLI, the objective, the current and period burn rates, the remaining error budget, and the error ratio by window. It shows the live value, so it has no hold band.
- Fleet Grid and Ops Wall dashboards. An “SLO compliance” tile that reads “n of m SLOs meeting objective” across clusters, using the same rule.
- Recent Activity, under the SLOs filter. This is where notifications from the poller
appear. Rows are colored by severity alone: red for
high, green otherwise.
Notifications
A backend module in Backstage (sloTransitionPoll.ts, scheduled from recentActivity.ts)
checks every SLO every 120 seconds and sends a notification when a signal changes state.
Each SLO has three independent signals:
| Signal | Fires when | Clears when | Titles |
|---|---|---|---|
| Budget exhausted | Period burn rate is above 1.0× | It drops below 0.9× | SLO Budget Exhausted / SLO Back Within Budget |
| Burning fast | Burn rate is above 14.4× over both 5 minutes and 1 hour | Either drops below about 13× (0.9 × 14.4) | SLO Burning Fast / SLO Burn Subsided |
| No data | No burn-rate series for 15 checks in a row (about 30 minutes) | Any check with data | SLO Has No Data / SLO Data Restored |
Titles read <app> · <title> (<slo>). The bad states are severity high and the recoveries
normal.
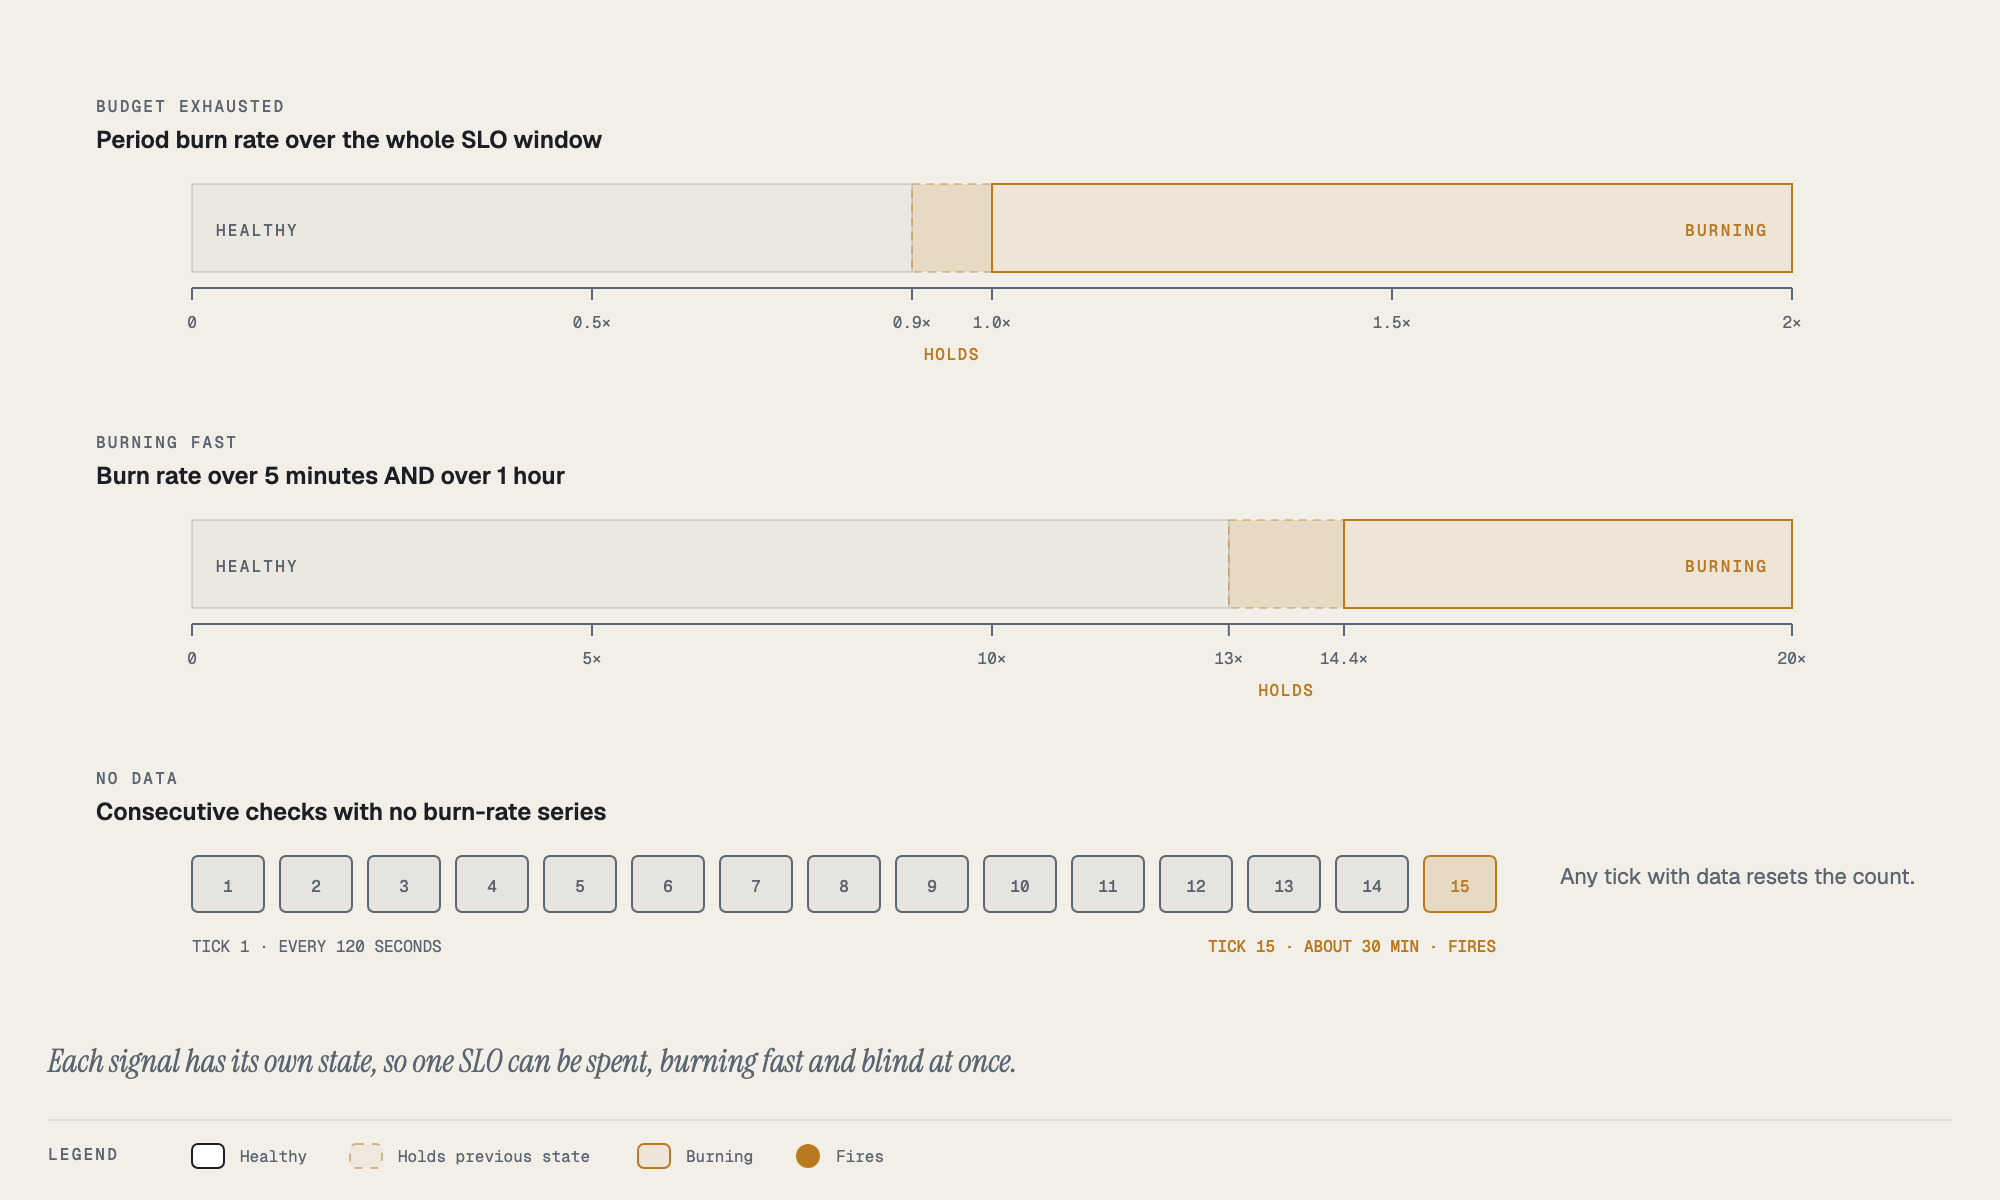
Why two burn signals. The period burn rate is a lagging “budget already spent” signal. An outage that ended an hour ago can leave it red for days, and a fresh outage on a healthy SLO can take a long time to push it over 1. The fast-burn pair is the “something is wrong right now” signal. 14.4× over an hour is 2% of a 30-day budget, and requiring the 5-minute window as well ignores a one-minute spike and lets the alert end quickly. Neither is a replacement for the other.
The hold band. Between the clear and fire levels the stored state holds. An SLO sitting near the line used to flip between burning and recovered every 10 to 30 minutes. It now stays put.
State and first sighting. Each signal is one row,
slo_transition_state, in the recent-activity plugin database (Postgres on prod). Keys are
<cluster>/<namespace>/<slo> for the budget signal, with #fast and #nodata appended for the
others. An SLO first seen burning is announced, and one first seen healthy is recorded
silently. A restart therefore neither replays old alerts nor loses a transition. The no-data
counter is the one thing kept in memory, so a restart can delay a no-data alert by at most 15
checks, and can never cause a wrong or duplicate one.
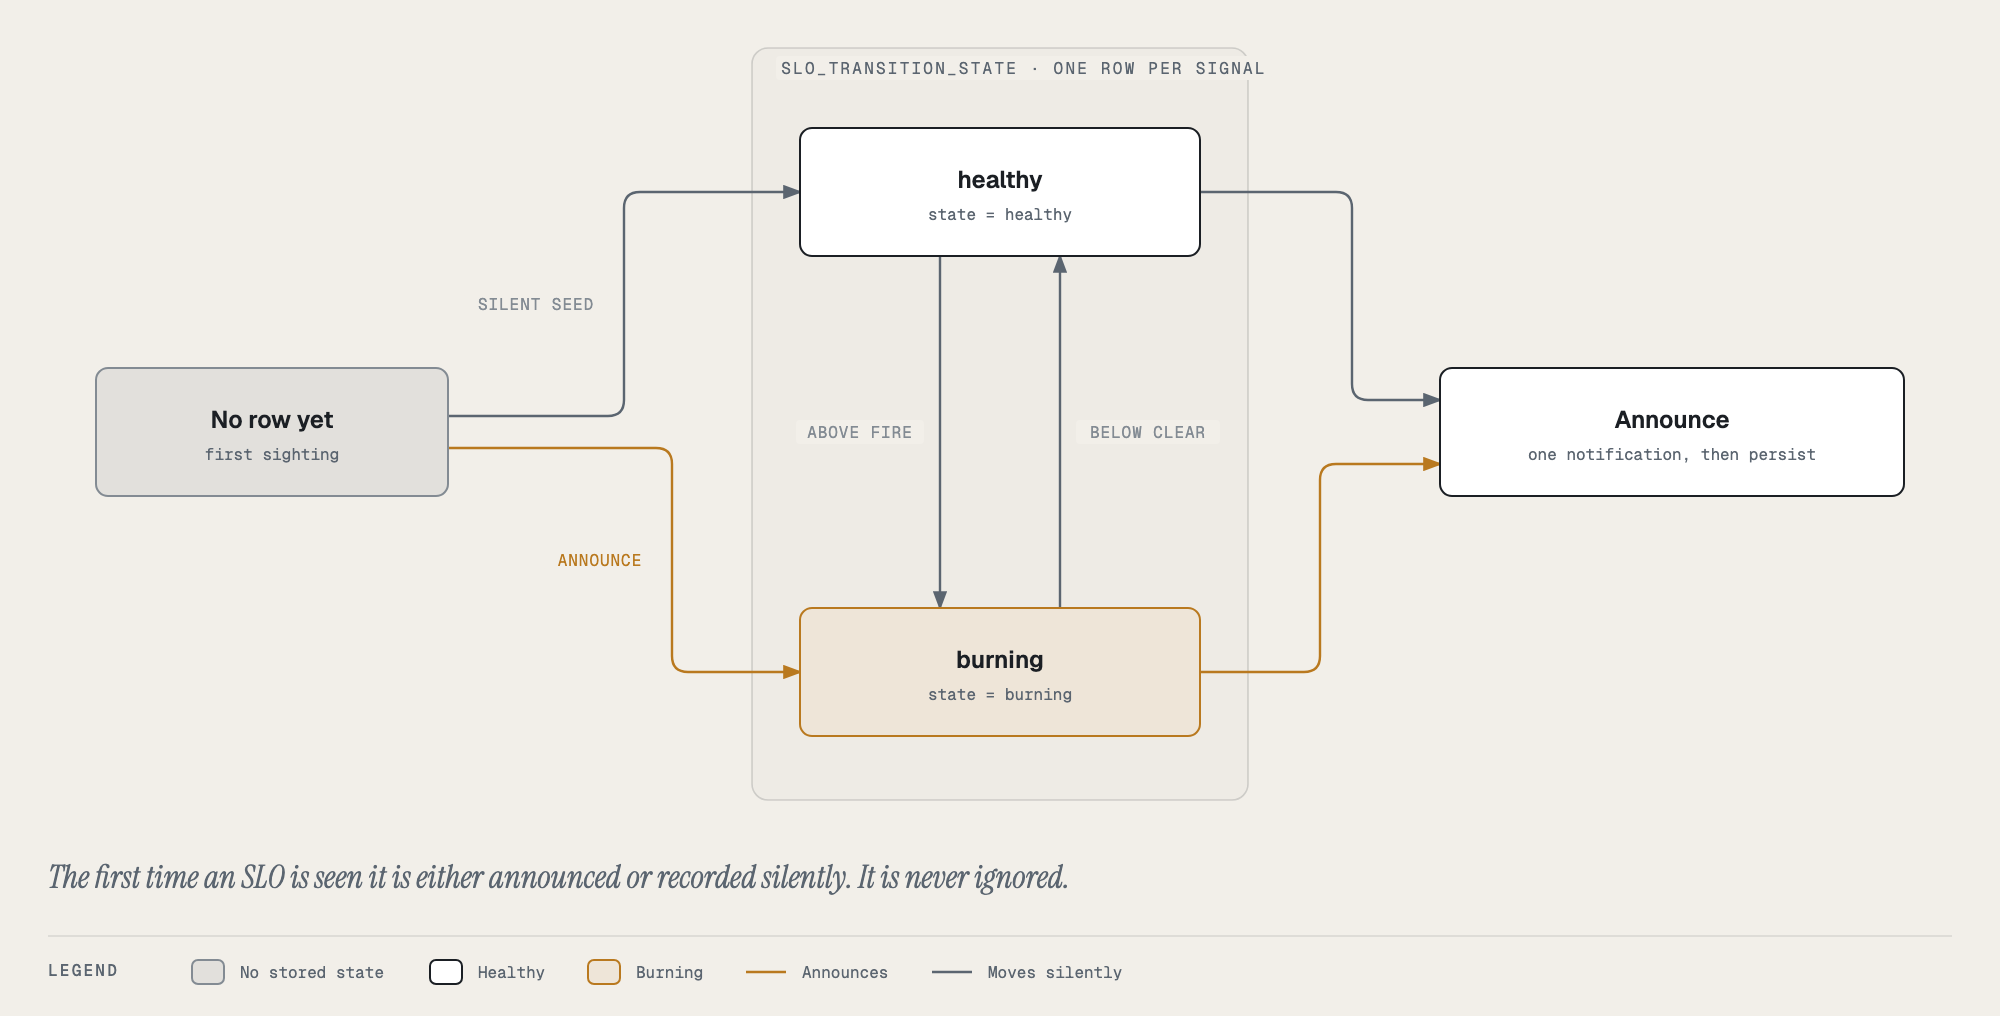
One tick:
- The scheduler runs the task on one replica at a time (global scope).
- For each cluster with a service-account token in
kubernetes.clusterLocatorMethods, it listsslos.catalog.hangar.io. A cluster without a token, including the in-cluster fallback, is skipped. - It runs three queries per cluster through the Kubernetes API’s
services/proxyto Prometheus: period burn, 5-minute burn, and 1-hour burn (slo:sli_error:ratio_rate1h / ignoring(sloth_window) slo:error_budget:ratio). Results are matched back to SLOs by label. - It classifies each signal, applying the hold band.
- For a changed signal it claims the row with a compare-and-set, announces, and keeps the claim. If the send fails the claim is undone, so the next tick retries.
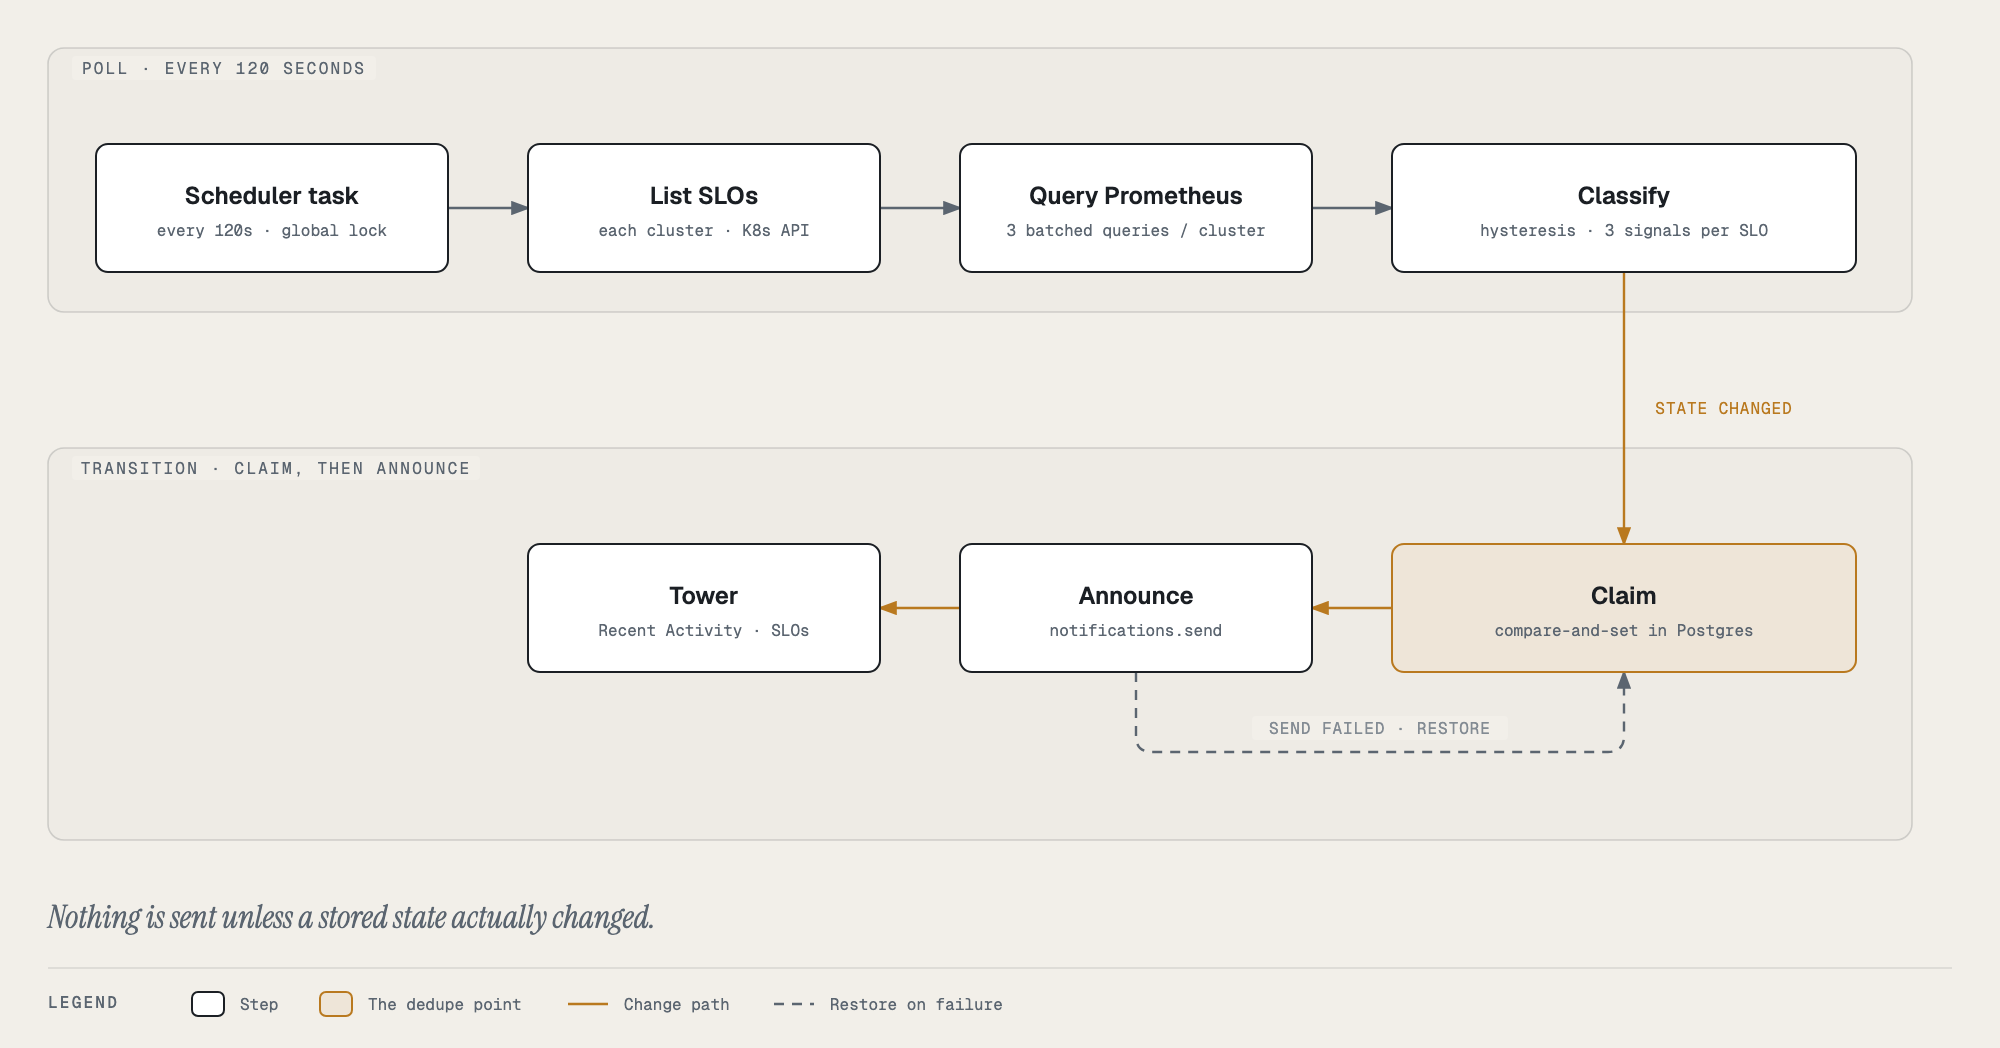
Three behaviors worth knowing:
- A failed Prometheus query is not “no data”. Only a successful query with no series counts, so a Prometheus outage never reads as every SLO going blind.
- A data gap on an SLO keeps its stored state, so a transition across the gap is announced afterwards.
- An SLO deleted from a cluster that listed successfully has its rows pruned. A failed listing prunes nothing.
Who is notified
Everyone, by default (a broadcast). To send to the app’s catalog owner instead, set
recentActivity.slo.recipients: owner in the Backstage app config. The owner comes from the
catalog entity’s spec.owner, normalized to a full entity ref. An app with no owner still
broadcasts, so a notification is never dropped for lack of one. Tower reads the per-user
notification API, so with owner set, only owners (and members of an owning group) see the row.
Tuning the thresholds
The defaults above are right for a 30-day window. To change them, set any of these in the Backstage app config (all optional; unset keys keep the default):
recentActivity:
  slo:
    recipients: owner          # broadcast (default) | owner
    budgetBurningAbove: 1.0    # period burn rate that fires Budget Exhausted
    budgetRecoveredBelow: 0.9  # clears below this; must be lower than the line above
    fastBurnThreshold: 14.4    # 5m AND 1h burn rate that fires Burning Fast (clears at 0.9x)
    noDataTicks: 15            # consecutive empty 120s checks before No Data
Values must be positive, noDataTicks must be a whole number, and budgetRecoveredBelow must be
lower than budgetBurningAbove (equal values would remove the hold band and let the signal flap).
An invalid value makes the poll fail with a clear error in the backend log instead of quietly
alerting wrongly. A change needs a Backstage restart. This deployment runs with
recipients: owner.
Operating it
Find out why nothing fired. Poller success is not logged. Only registration and failures
(recent-activity: ...) appear. Absence of a warning does not prove it ran. Check the data
instead:
# stored state, read-only, in the recent-activity plugin database
kubectl --context prod -n backstage exec backstage-postgres-postgresql-0 -- bash -c \
  'export PGPASSWORD="$(cat $POSTGRES_POSTGRES_PASSWORD_FILE)"
   psql -U postgres -d backstage_plugin_recent-activity -At \
     -c "select key, state, updated_at from slo_transition_state order by key"'
# what was sent: database backstage_plugin_notifications, table broadcast, topic = 'slo'
Query Prometheus directly. Port-forward svc/kube-prometheus-stack-prometheus in the
observability namespace and ask for slo:period_burn_rate:ratio{sloth_service="<app>"}.
query_range shows exactly when a flip happened.
Exercise it without breaking anything. Burn rate is the error ratio divided by
1 - objective, so editing objective in an environment’s values file flips an SLO’s state
without touching the app. Each step is one GitOps sync plus up to one 120-second poll. The
flight-api dev environment has two test SLOs for this. Its readiness probe really does fail
a few percent of the time, and no app on the platform exports request metrics, so the SLI is
kubelet’s own prober_probe_total. Verified on 2026-10-01: lowering the objective from 95 to 85
(burn 2.05× to 0.62×) sent SLO Back Within Budget, and raising it to 97 (burn 3.13×) sent
SLO Budget Exhausted.
Limits
- Only clusters whose Backstage entry names a credential (a token file or a token) are polled. The
in-cluster entry has neither, so a cluster with SLOs but no such entry is silent. On dev the
credential is the Backstage pod’s projected, federated token (Tower
docs/credentials/index.md). - Prometheus is reached through the Kubernetes API proxy, so the poller needs
getonservices/proxyfor that Service. On dev the federated readerhangar:prod:backstage-ingestorhas it. - There is no deduplication across different SLOs. If two SLOs on one app both burn, you get two notifications.
- The notification text is fixed. The thresholds are configurable (see below).
Where the code is
| Piece | Location |
|---|---|
| SLO schema | airframe/xrds/slo.yaml |
| Composition and templates | airframe/compositions/slo/ |
| Chart hook | airframe/charts/airframe-application/templates/attached/slos.yaml |
| Poller and state machine | backstage/packages/backend/src/sloTransitionPoll.ts |
| Scheduling and recipients | backstage/packages/backend/src/recentActivity.ts, catalogApps.ts |
| Tower views | tower/src/tabs/SlosTab.tsx, tower/src/useFleetSlos.tsx, tower/src/tabs/dashboard/ |
| Diagram source | hangar/tools/diagrams/e_k.py |