
Docs · Glidepath
Features
A capability tour: what this platform actually gives you beyond “runs my build,” and where to go for the full depth on each. For field-by-field config, see cicd-yaml-reference.md.
The four stages
Every pipeline is built from up to four stages, each a real Tekton Pipeline in the
shared catalog. You don’t write any of them - you declare which ones you want, in what
order, under pipelines: in cicd.yaml.
| Stage | What it does | Typical trigger |
|---|---|---|
build |
Compiles/packages your app, runs unit tests, builds and pushes a container image | push, pull_request, or tag |
test |
Runs ./integration-test.sh against the built image |
Chained from build |
deploy |
Commits straight to your repo’s platform/envs/<env>.yaml, picked up by ArgoCD - fast, ungated, for inner-loop feedback |
Chained from test |
release |
Opens a PR against your gitops-<app> repo, gated by governance checks + human review - never touches the cluster directly |
Chained from deploy, or git-rooted on a tag |
Two very different deploy paths, on purpose
deploy and release look similar (both “ship this image somewhere”) but are
deliberately built to completely different standards, because they answer different
questions:
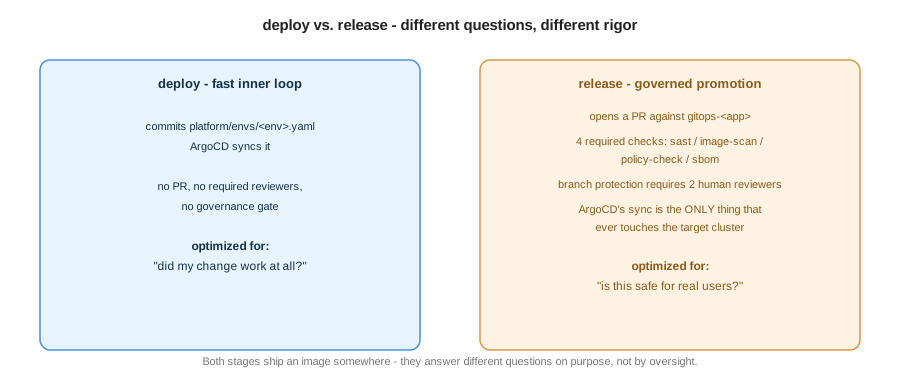
This is why deploy’s target environments (deploy.lowerEnvironments) and release’s
(conceptually “upper” environments, though env on a release step has no live effect
yet) are configured separately - see
cicd-yaml-reference.md. Full detail on the
release mechanics in ../admin/release.md.
Build dependency caching
Persistent, per-app npm/Maven download cache, opt-in via build.cache.enabled: true.
Keyed by a hash of your lockfile, so a dependency change gets a fresh cache
automatically instead of serving stale packages. See
cicd-yaml-reference.md.
Build source volume sizing
T-shirt-sized build.sourceVolume.size (small/medium/large/xlarge) for the ephemeral
per-run source workspace - checked-out repo, build output, kaniko’s build context.
Bump it if a large build fails with no space left on device. See
cicd-yaml-reference.md.
Governance gates - real, not stubs
governance.sast/imageScan/policyCheck/sbom each wire in a genuinely-enforcing
gate, not a placeholder that always passes:
sast- real Semgrep scan.imageScan- real Trivy scan.policyCheck- real gitsign commit-signature verification againstgovernance.allowedCommitSigners. See ../admin/commit-signing.md.sbom- real cosign SBOM attestation.
On a release, these four run as independent, individually-required GitHub status
checks against the gitops PR - branch protection won’t let the PR merge until all four
pass and the required reviewer count is met. See
../admin/governance-stubs.md for exactly what each one verifies, and
../admin/image-signing.md / ../admin/provenance-policy.md
for the SLSA provenance signing/verification underneath all of this (Tekton Chains +
keyless Fulcio signing + Conforma policy evaluation - genuinely @slsa3-passing, not
theatrical).
Ephemeral environments
Spin up a real, temporary, fully-deployed copy of your app per branch or per PR - useful for reviewing a change without merging it first.
ephemeralEnvironments:
  pullRequest:
    enabled: true
    labels: ["preview"]   # add this label to a PR to get it a live environment
  ttl: 3d                 # torn down automatically 3 days after its last deploy
Backed by an ArgoCD ApplicationSet pullRequest generator (or a branch-pattern
generator for the branch: form) - the environment appears and disappears without you
running anything by hand. See ../admin/ephemeral-environments.md.
Notifications
notifications:
  slack:
    enabled: true
    channel: "#team-deploys"
    scanResults: true   # separate, shift-left pings the moment a scan finishes
Real content, not “pipeline finished” noise - build/test/deploy/release status plus failure log excerpts land directly in your channel. See ../admin/notifications.md and ../admin/design-language.md for the shared visual language across Slack/Grafana/GitHub Checks.
Full tracing across every stage
Every flow gets a single OpenTelemetry trace spanning every stage it runs through - a
build → test → deploy → release chain shows up as one connected trace in Tempo,
not four disconnected ones, even though each stage is a genuinely separate Tekton
PipelineRun potentially minutes apart. CDEvents carry the trace context between stages.
See ../admin/tracing.md and ../admin/chaining.md.
DORA metrics
Deployment frequency, lead time for changes, change failure rate, and MTTR, computed from the same CDEvents every pipeline already emits - no separate instrumentation needed in your app. See ../admin/dora-metrics.md.
Stalled-pipeline detection
A background detector that notices when a stage that should have started (based on the previous stage’s completion) never did, and alerts - catches the class of bug where an event silently fails to trigger the next stage, rather than leaving you to notice a “missing” deploy on your own. See ../admin/stalled-pipeline-detector.md.
What’s schema-accepted but not live yet
Documented here so you don’t spend time debugging a config that can’t possibly do anything - these are accepted by the schema and reserved for known future work, not typos:
deploy.strategy: deployment- a plain Deployment isn’t rendered anymore; every deploy provisions an Argo Rollout (canary/blue-green) regardless of this value.rolloutis now the real, default behavior -deploymentis kept schema-valid only so an existing cicd.yaml that sets it explicitly still validates.build.sonar- reserved, no current effect.
Multi-cluster releases (deploy.upperEnvironments’ {name, cluster} form,
pipelines.*.steps[].cluster) are real and live - see
multi-cluster.md, not this list.